zMUD provides several tools for helping you to debug your complex scripts. First, the settings editor itself performs syntax checking as you enter your scripts. Keywords are highlighted and script elements are color-coded. In addition, help tips about the commands and arguments that you are typing automatically appear at the bottom of the window. You can also enable syntax checking in the built-in Editor window.
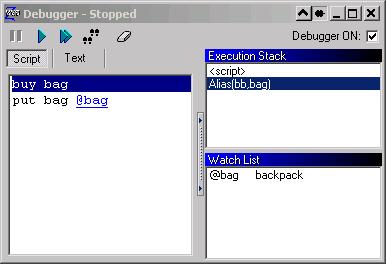
In addition to syntax checking as you type, zMUD also contains an integrated Debugger. To activate the Debugger, select it from the Windows menu. The Debugger window is split into three sections. The large section on the left will display the script that is running. The upper-right section displays the current execution stack. The lower-right section displays the current Watch List.
The Watch List
The Watch List displays any variables or expressions that you want to watch as your scripts execute. Whenever one of these expressions changes, it's value is updated in the Watch List. To add an expression to the list, right-click and select Add. To remove an expression, right-click on it and select Delete. You can also add expressions to the Watch List from the command line or from a script using the #WATCH command. For example, to watch the value of a variable called HitPoints, you'd use the command:
#WATCH @HitPoints
You can remove an expression from the Watch List using the #UNWATCH command:
#UNWATCH @HitPoints
Any number of expressions can be entered into the Watch list. However, this list is not saved when you exit zMUD.
The Execution Stack
zMUD scripts can contain sub-scripts, or nested scripts. For example, the command:
#IF (@HitPoints < 100) {heal}
is a script which contains the nested script "heal". The nested script is executed if the @HitPoints<100 expression evaluates to true. Another example of a nested script is:
#ALIAS Nested {I am nested}
#ALIAS Main {Main Script;Nested;Back to Main}
The script "Main" calls the nested script called "Nested".
The Execution Stack in the Debugger displays the name of the current script, along with all of the currently active scripts above it. In the above example, if the debugger was stopped in the Nested script, the Execution Stack would show the "Main" script, followed by the "Nested" script. So, the Execution Stack shows you how zMUD got to the script that it is working on, whether from another script, a trigger, an #IF statement, or whatever.
The Script Display
The main section of the window on the left displays the currently executed script. In the above example, if you double-clicked on the "Nested" script in the Execution Stack, the script window would display "I am nested". If you double-clicked on the Main script, the script window would show:
Main Script
Nested
Back to Main
and the "Nested" line would be highlighted to show that it was the last line executed in that script.
The Toolbar
The Toolbar at the top of the window contains buttons for controlling your script execution. You can pause execution at any time. One execution is paused, you can then single-step through a script, or run through the end of the current script and stop when it gets back to it's parent script. There is also a button for clearing breakpoints, which are discussed later.
An Example
Let's look at a simple debugging example. Make sure the Debugger is active by selecting Debugger from the Windows menu. Now, click the Pause button in the Debugger. This will stop all script execution. You should do this test offline so that any triggers you might have running won't be interrupted by this test.
Now that execution of scripts is paused, enter the following script on the command line:
start;#IF (2=2) {value is true};end
When you press Return, your command will be executed, and will immediately be loaded into the debugger where execution will pause. The script window will show:
start
#IF (2=2) {value is true}
end
and the "start" line will be highlighted. The highlight shows that the start command is the next command that will be executed. Click the Single-Step button in the debugger. The "start" line will be executed (which will display "start" in your MUD window). Then the highlight will move down to the #IF statement. Click the Single-Step button again. The #IF statement will be executed. Since the expression 2=2 is true, the nested script "value is true" will be loaded.
Now your Execution Stack will show two scripts. The second script will be highlighted and the Script Window will show the "value is true" line. If you double-click on the first script in the Execution Stack, you'll be back at the previous script display, showing that the #IF statement is being executed. Double-click on the second script again to get back to the "value is true" script. Click the Single-Step button. The command will be executed and "value is true" will be displayed in your MUD window. Now the debugger will be back to the main script, with the "end" line executed. Click the Run button in the Debugger to finish running the script. The string "end" will then be displayed in your MUD window and the Debugger will then be blank.
This shows a sample debug session in action. While debugging you can add values to the Watch List in order to see what the value of certain variables might be. You can single-step through your script to find out what might be causing them to fail.
Breakpoints
Stepping through a large script line by line can be tedious. Sometimes you know that the trouble is far down in the script and you don't want to always step through the lines at the beginning that are already working. To stop your script in the middle and load the debugger, you need to set a BreakPoint. zMUD supports several different types of breakpoints.
First of all, you can use the #BREAK command in your script. When zMUD executes the #BREAK command, execution is stopped and your script is loaded into the debugger. This is a very powerful method, since you can also use #BREAK within an #IF statement to only break when a certain condition is reached. For example, maybe you only want to break when your @HitPoints<10. So you'd use a line in your script:
#IF (@HitPoints < 10) {#BREAK}
Also, breakpoints are only executed if the Debugger is enabled. The checkbox in the upper-right corner of the debugger can be used to enable or disable the debugger. So you can decide only to enable the debugger when something specific happens on your MUD, thus activating any breakpoints you have set.
A second type of breakpoint can be set on certain zMUD objects themselves. You can set Object Breakpoints on Aliases, Triggers, and Variables. To set an object breakpoint, go into the Settings Editor. Right-click on the object you want, and select the Break command. The object will be highlighted in red in the settings editor to remind you that a breakpoint has been set.
Alias breakpoints cause execution to stop when the given alias is executed. The debugger will load the script for the alias and then stop on the first line of the alias. The Execution Stack will display any parameter values sent to the alias.
Trigger breakpoints cause execution to stop when the Trigger is executed. The script for the trigger will be loaded into the alias and execution will stop on the first line. The Execution Stack will display any parameter values (%1..%99) used by the trigger.
Variable breakpoints cause execution to stop when a new value is assigned to the variable. Execution is stopped right *after* the new value is assigned.
You can clear all Object Breakpoints using the Clear button in the Debugger window. Only Object Breakpoints will be cleared. Any #BREAK commands must be removed manually.
